delS/delT = -β*S*I/N
delI/delT = β*S*I/N - α*I
delR/delT = α*I
from where,
β = delS/(I*S/N)
α = delR/I
where delT = 1 day, since that is how frequent the available data is.
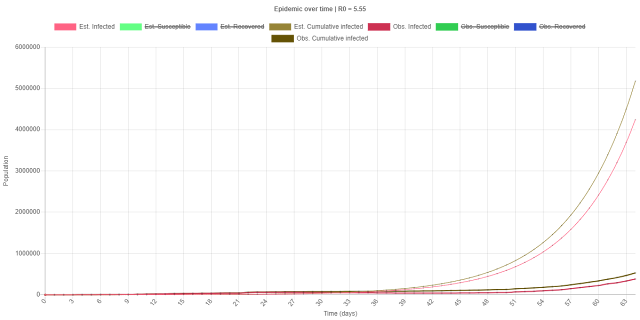
Now, the Susceptible population S, Infective population I and the Removed population R aren't available as such. The time series data source mentioned above gives the daily recorded data for each country since Feb. 22, 2020. This is converted into a global daily record time series data by summing over all the countries. The final form looks something like this, and this is for a particular date:
The 'confirmed' value corresponds to all the active infections (which meets the definition of the infective population in our model) + the 'deaths' + the 'recovered' values.
So, for the infective population, I = confirmed - deaths - recovered
and for the susceptible population, that's the global population minus the people who are still in active infection and those who've recovered or died combined i.e. S = N - confirmed
I tried doing a simple power-law function fitting for the alpha and beta parameters using the Least Square Technique (LST) here but ultimately decided against using it in the model as I thought their time-evolution should be more logistic-like rather than monotonous. For that spreadsheet, I used data attributed to Mathemaniac after watching his video
Perhaps I could use the latest 5-day or 14-day averages for better estimating the model parameters. The model would do even better if I could figure out β(t) and α(t) for the entire duration of the epidemic since the parameters seem to be constantly fluctuating IRL.
Anyway, here is the code.
Edit: I've removed the (flawed) max/min parameter estimation and added last 5 and last 14 data based parameter estimation. Doesn't seem to do much good.
Edit: I've only now realized that web apps that don't require/have a back end i.e. web pages that don't require server-side coding can be hosted on GitHub itself! I have thus pushed this project to GitHub as a repository. The corresponding GitHub Pages site is here. I will be pushing all future JavaScript web apps directly to GitHub as repositories of their own; no more GitHub Gist for such programs. All update to the apps will be applied to their corresponding GitHub repositories, not their Gists. I will also be shortly porting all my past JavaScript web apps in this blog that I'd uploaded to GitHub Gist to GitHub as repositories.


No comments:
Post a Comment